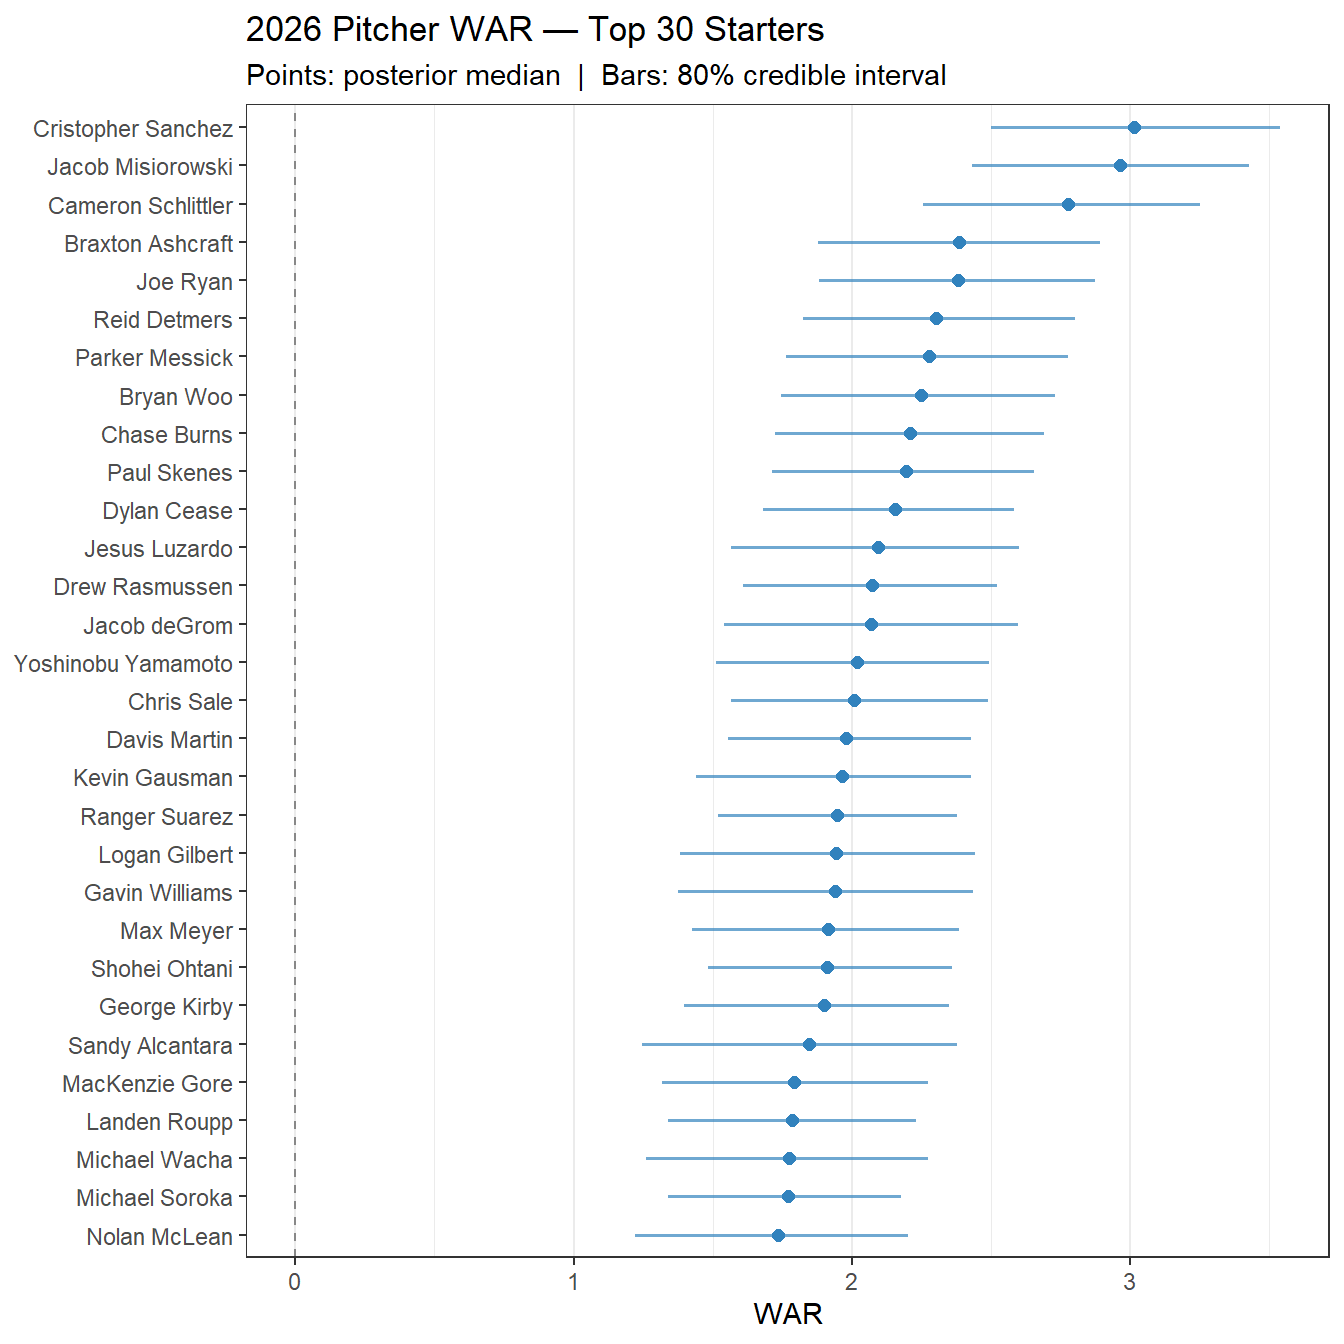
2026 Pitcher WAR
Starters, ≥10 IP
Pitcher WAR estimated from a hierarchical Bayesian model fit to per-start FIP components (K+IFFB, BB+HBP−IBB, HR). Partial pooling shrinks low-inning pitchers toward the league average. Intervals are 80% posterior credible intervals.
80% credible intervals for the top 30 starters by posterior WAR.
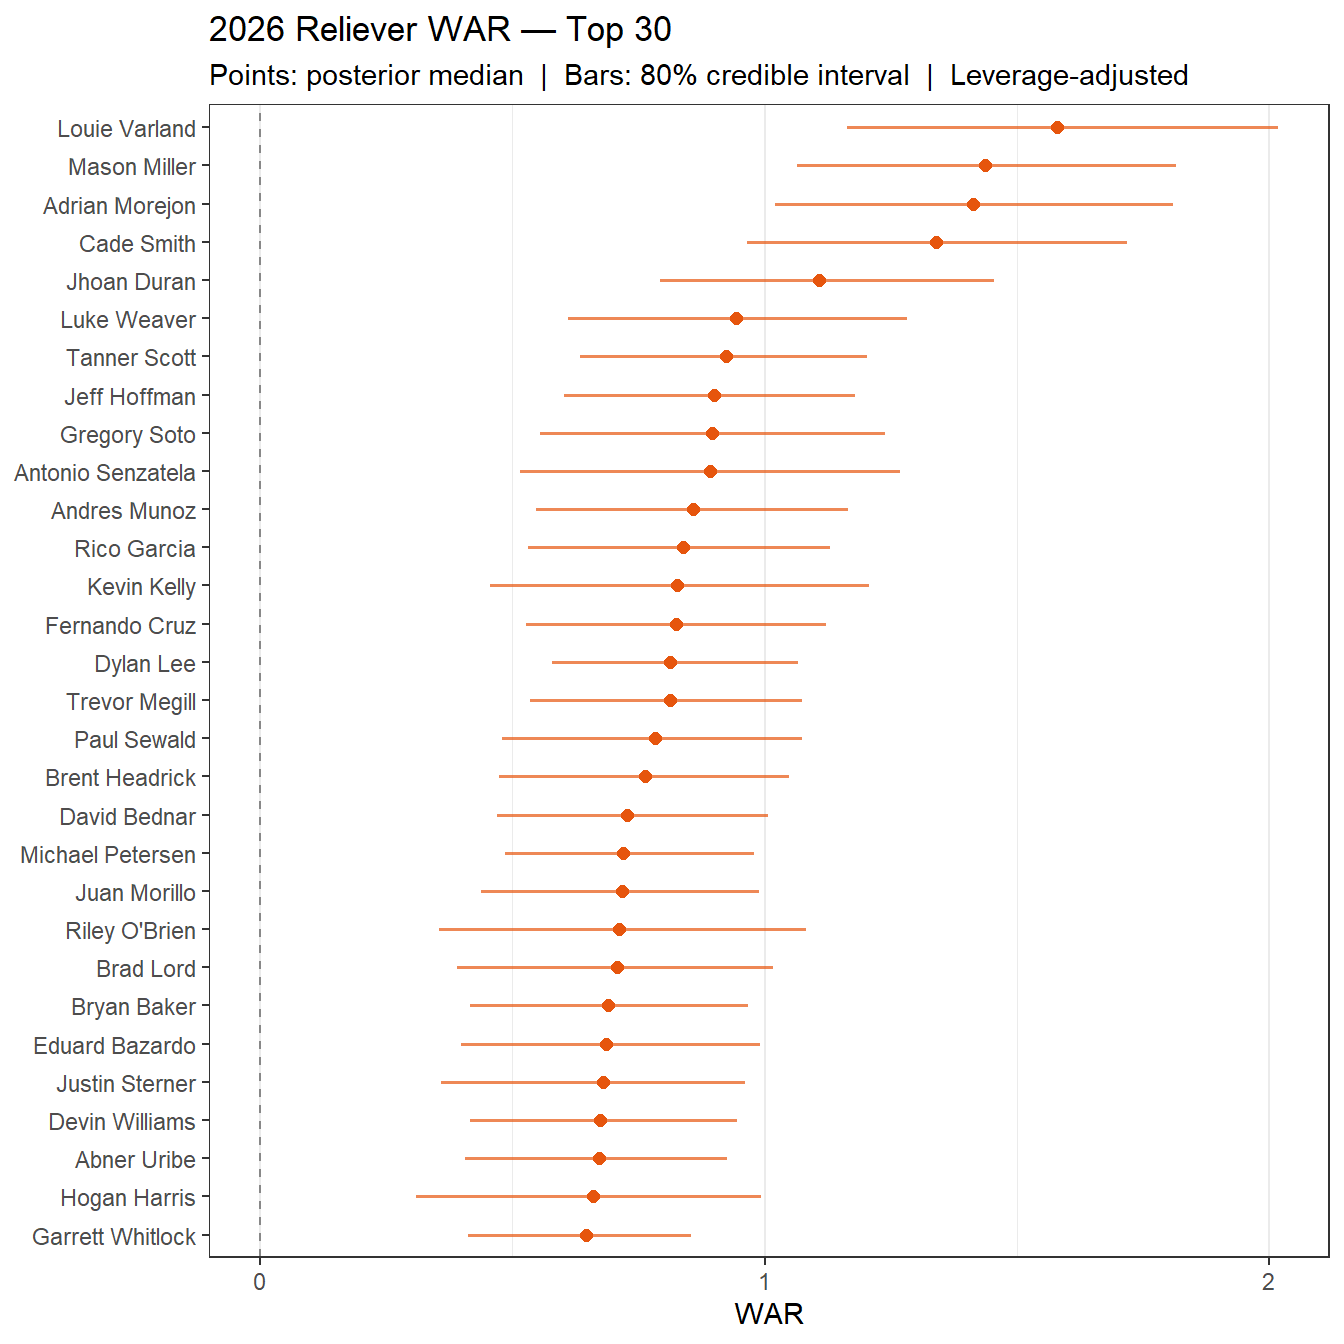
Reliever WAR uses the same hierarchical FIP model as starters, fit separately on relief appearances. WAR is scaled by each pitcher’s season-average game-entering leverage index (gmLI): an inning pitched in high-leverage situations counts for more. Replacement level is lgFIP + 1.0 (vs. + 1.5 for starters). Intervals are 80% posterior credible intervals.
80% credible intervals for the top relievers by posterior WAR.
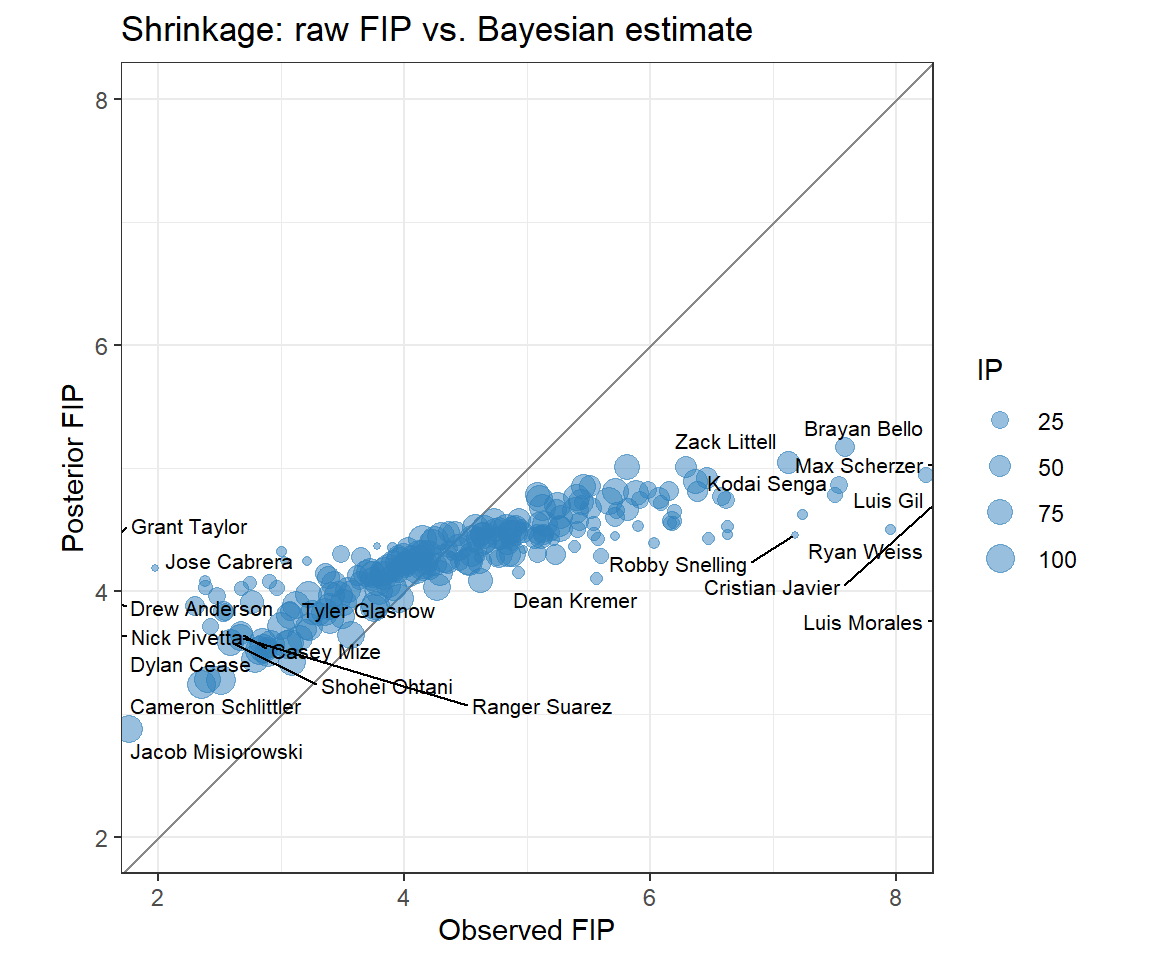
Each point is a pitcher; the diagonal is y = x (no shrinkage). Good pitchers (low raw FIP, left side) are pulled upward toward the league mean; high-FIP pitchers are pulled downward. Low-IP pitchers move the most because the model trusts their small sample least.
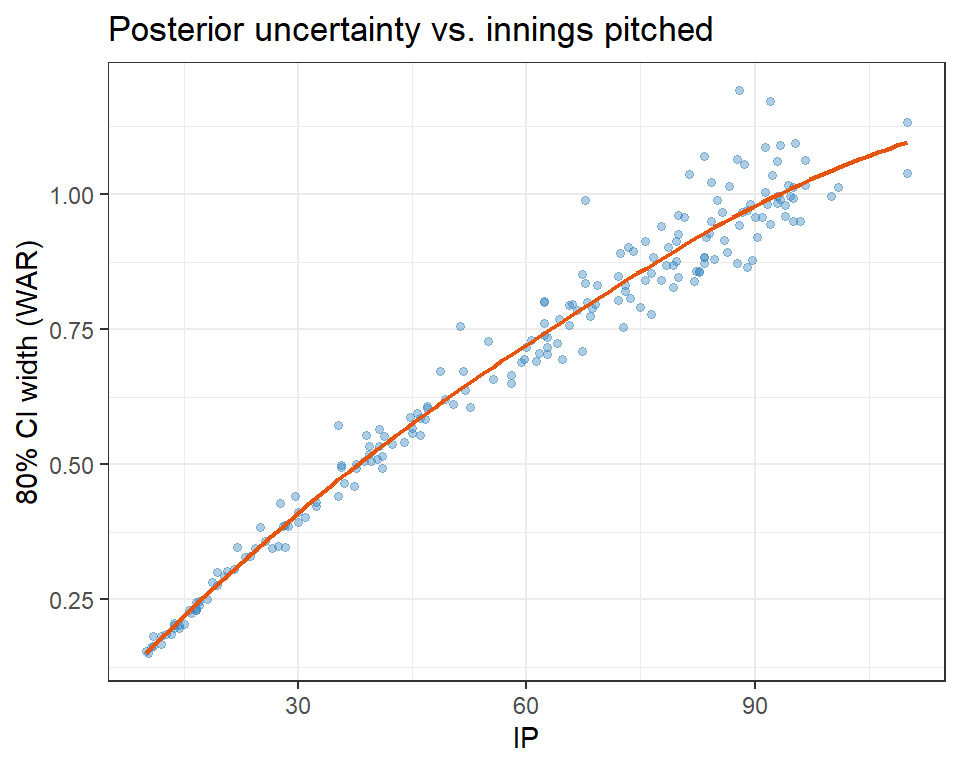
Credible interval width should fall with innings pitched: a 200-IP ace should have a tighter estimate than a 30-IP spot starter. A flat or upward trend would suggest the model is not learning from the data.
Total WAR (IP≥10): 205.9 across 204 pitchers ⚠ outside expected range
292 pitchers above replacement
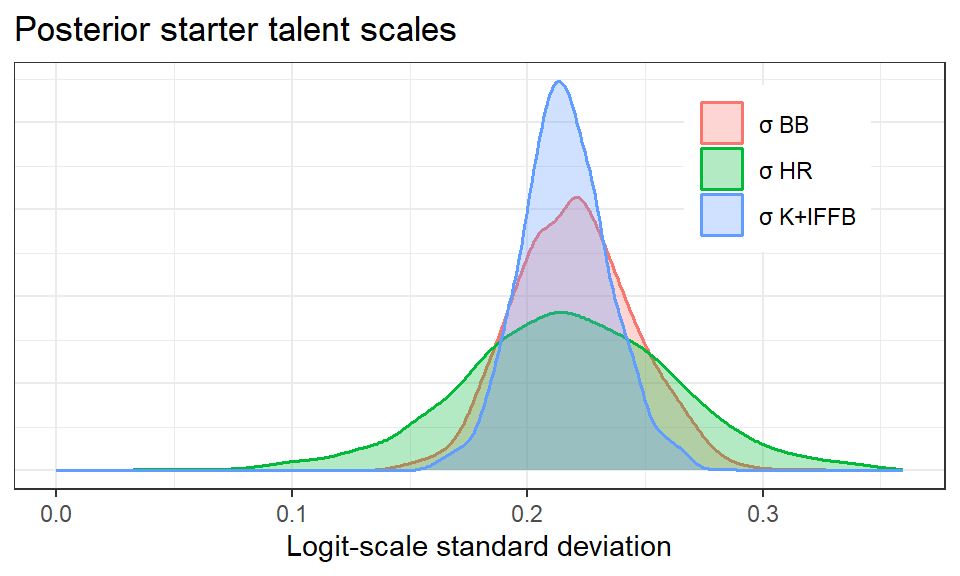
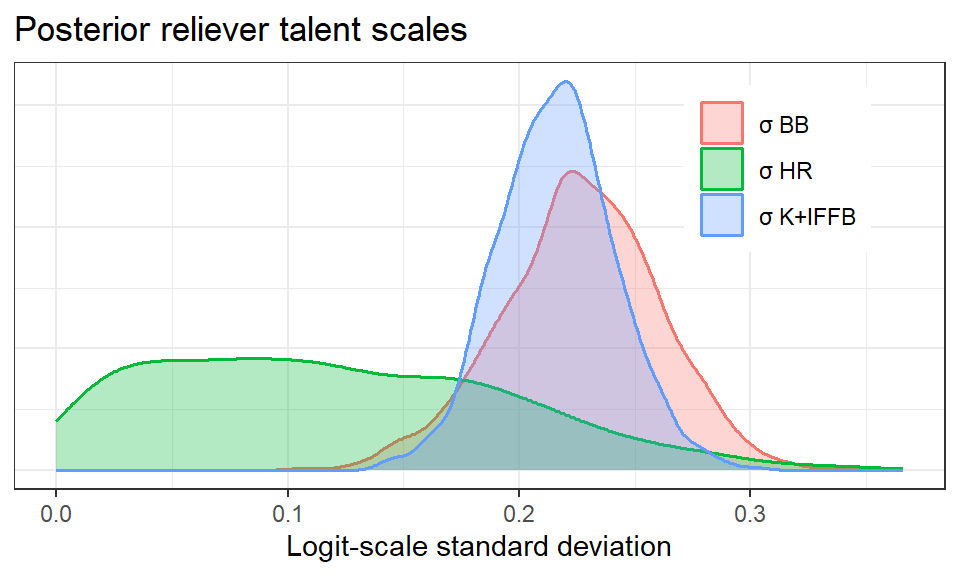
Expected: ~75–100 for this season lengthThe \(\sigma\) parameters measure how much pitcher-to-pitcher spread the model found in each FIP component. Values well above zero confirm genuine talent variation; a spike near zero would mean the model sees pitchers as essentially interchangeable for that component.
| variable | mean | sd | q5 | q95 | rhat | ess_bulk |
|---|---|---|---|---|---|---|
| sigma_k | 0.216 | 0.019 | 0.186 | 0.247 | 1.0 | 681.4 |
| sigma_bb | 0.220 | 0.025 | 0.180 | 0.263 | 1.0 | 857.1 |
| sigma_hr | 0.217 | 0.045 | 0.143 | 0.289 | 1.0 | 653.7 |
| phi_k | 128.635 | 26.050 | 90.243 | 177.988 | 1.0 | 832.5 |
| phi_bb | 75.288 | 22.547 | 43.803 | 118.704 | 1.0 | 810.8 |
| phi_hr | 28.504 | 15.184 | 10.664 | 56.890 | 1.0 | 810.0 |
| variable | mean | sd | q5 | q95 | rhat | ess_bulk |
|---|---|---|---|---|---|---|
| sigma_k | 0.216 | 0.025 | 0.176 | 0.259 | 1.0 | 704.8 |
| sigma_bb | 0.227 | 0.034 | 0.168 | 0.281 | 1.0 | 714.1 |
| sigma_hr | 0.120 | 0.076 | 0.013 | 0.252 | 1.0 | 485.6 |
| phi_k | 109.304 | 25.255 | 72.776 | 154.024 | 1.0 | 858.8 |
| phi_bb | 61.312 | 21.104 | 32.829 | 101.429 | 1.0 | 1,018.8 |
| phi_hr | 32.931 | 17.320 | 11.926 | 64.425 | 1.0 | 938.5 |